Correlation vs causation is the oldest warning in statistics, and it matters more than ever now that models find patterns for us. A model will happily tell you that customers who do X are less likely to leave. It cannot tell you whether making customers do X will keep them. That gap is where expensive decisions go wrong.
What the difference actually is
Correlation means two variables tend to move together. Measure it with the correlation coefficient r, which runs from −1 to +1 (the covariance vs correlation guide shows how it is computed). Causation means that changing one variable, with everything else held fixed, changes the other.
Correlation is something you can read from a spreadsheet. Causation is a claim about what would happen if you intervened. The data you passively collect can show you the first; on its own it rarely proves the second.
Confounders: the ice cream problem
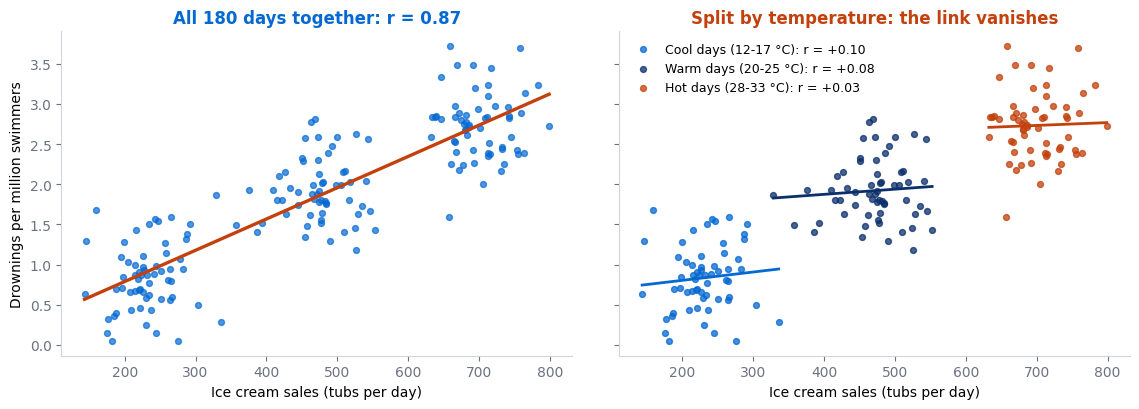
The classic example: towns that sell more ice cream see more drownings. Nobody believes ice cream causes drowning. Hot weather drives both, because people buy ice cream and people go swimming. Temperature is a confounder, a third variable that causes both of the things you are looking at.
The figure shows this with simulated data. Over 180 days, sales and drownings correlate strongly, r = 0.87. Now split the days into three temperature bands and look within each band. On cool days r = 0.10, on warm days 0.08, on hot days 0.03. Once you compare like with like, ice cream tells you almost nothing about drownings. All of the original correlation was temperature in disguise.
🧪 A business version of the same trap
But who installs an app for a shop? Mostly people who already shop there a lot. Existing loyalty is the confounder: it drives both app use and spending. Forcing casual customers to install the app may change very little, because the app was a symptom of loyalty rather than its cause.
The check is the same as in the figure: compare app users with non-users who had similar spending before the app existed. If the gap shrinks sharply, a confounder was doing the work.
Three more ways correlation misleads
Reverse causation. The arrow points the other way from the one you assumed. Customers who contact support are more likely to cancel, so should you make support harder to reach? No: having a problem causes both the support call and the cancellation. Likewise, cities with more police officers have more crime, largely because high-crime areas hire more police.
Selection bias. The way data was collected creates a pattern that does not exist in the wider world. In the Second World War, analysts studied bullet holes on returning bombers and proposed armouring the most damaged areas. The statistician Abraham Wald pointed out that they were only seeing planes that survived; the places without holes were where hits brought planes down. In ML, a model trained only on approved loan applicants never sees how rejected applicants would have behaved, and learns a skewed picture as a result. The bias in machine learning guide covers how to check for this.
Spurious correlations from chance. Test enough variables and some will correlate by pure luck. In a quick simulation, 1,000 columns of random noise were compared against a random target with 50 rows. 38 of them correlated with it at more than |r| = 0.3, and the best reached 0.53, all with no relationship whatsoever. Wide datasets with few rows are exactly where this bites, which is why a correlation matrix full of moderate values proves very little on its own.
| Trap | What is really happening | Question to ask |
|---|---|---|
| Confounder | A third factor drives both | What else could cause both of these? |
| Reverse causation | Y causes X, not X causes Y | Which came first? |
| Selection bias | The sample was filtered | Who is missing from this data? |
| Chance | Many comparisons, few rows | Does it hold on fresh data? |
Why ML models learn correlations
A supervised model is trained to predict the target from the features as accurately as possible. It has no idea which features cause the target and does not need one: anything that correlates with the answer helps. A linear regression coefficient or a feature importance score tells you how useful a feature was for prediction, not what would happen if you changed it.
For pure prediction, that is fine. If ice cream sales help forecast lifeguard demand, use them. The trouble starts when a prediction becomes a decision.
A well-known case from the 1990s: a model predicting pneumonia mortality learned that patients with asthma were at lower risk. The pattern in the data was real. Asthma patients were sent straight to intensive care, and the aggressive treatment protected them. Used to decide who could be sent home, the model would have sent home some of the most vulnerable patients.
⚠️ When correlation-based models break
- You act on a feature. Changing a feature the model relies on does not guarantee the outcome changes, unless the feature is a genuine cause.
- The world shifts. A shortcut the model found, such as a scanner label that happened to track disease rates at one hospital, stops working at the next hospital. Good test scores on the same kind of test data will not warn you.
- Your model changes behaviour. Once a deployed model influences decisions, it changes the data it is later retrained on, and the old correlations can dissolve.
The fix: randomised experiments and A/B tests
The reliable way to establish causation is to intervene at random. In a randomised experiment you assign the treatment by coin flip, not by choice. Because the coin cannot know who is loyal, rich, young or already sick, every confounder, measured or not, ends up roughly equally spread across both groups. Any difference in outcome can then be put down to the treatment.
In tech this is the A/B test. Randomly show 10,000 visitors the old checkout page and 10,000 the new one. If the old page converts 4.0% and the new one 4.6%, and a significance test says the gap is unlikely to be chance (a p-value calculator will do the arithmetic), you have evidence that the new page causes more sales, which no amount of observational data could give you.
🔑 Key Takeaways
- Correlation says two things move together; causation says changing one changes the other.
- Confounders can create strong correlations: r = 0.87 overall fell to about 0.1 or less within temperature bands.
- Reverse causation, selection bias and chance produce convincing but misleading patterns too.
- ML models learn whatever correlates with the target, so their importances are not causal claims.
- Randomised experiments and A/B tests balance hidden confounders and are the reliable route to causation.
Further reading
Wikipedia’s article on why correlation does not imply causation catalogues the patterns above with historical examples, and Tyler Vigen’s Spurious Correlations collection shows how many absurd matches chance alone produces.
Where to go next
- Covariance vs correlation — how the correlation coefficient is calculated
- Statistics for machine learning — the wider toolkit behind experiments
- Bias in machine learning — checks for skewed data before you ship
- Start Here — the full learning path