Linear Regression Calculator y = a + bx
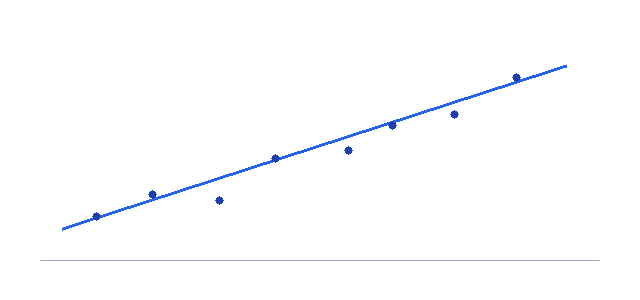
Fit a line of best fit by least squares: slope, intercept, R² and predictions.
Show working (LaTeX)
This free linear regression calculator fits the line of best fit to your data by least squares, returning the slope, intercept, correlation, R² and predictions.
How to use the linear regression calculator
Enter your X and Y values into the linear regression calculator above and press Fit line. It computes the least squares regression equation, the slope and intercept, the correlation r and R², and will predict y for any x you give it. As a line of best fit calculator and least squares calculator, it does the algebra for you.
What is linear regression?
Linear regression models the relationship between two variables as a straight line. See the simple linear regression reference for the derivation.
Regression formula
$$b=\frac{\sum (x_i-\bar{x})(y_i-\bar{y})}{\sum (x_i-\bar{x})^2}\qquad a=\bar{y}-b\bar{x}$$How to find the line of best fit step by step
- Find the means of x and y.
- Compute the slope b from the formula above.
- Get the intercept a, then read R² to judge the fit.
Worked example
For X = 1,2,3,4,5 and Y = 2,4,5,4,6, the least squares line is about $y=1.8+0.8x$, with R² ≈ 0.73.
Why linear regression matters in machine learning
Linear regression is the first model in machine learning for beginners — the foundation of supervised learning. It relies on the standard deviation and on minimizing a loss with the derivative.
🤖 ML insight
Training linear regression means minimizing the mean squared error — exactly what gradient descent does by following the derivative of the loss downhill.
Frequently asked questions
What does this linear regression calculator output?
How many data points do I need?
What does R² mean?
What is least squares?
Is the linear regression calculator free?
Reading the results
The slope tells you how much y changes for a one-unit rise in x, and the intercept is the predicted y when x is zero. A positive slope means the variables move together; a negative slope means they move apart. The correlation r shares the slope’s sign and ranges from −1 to 1.
Always plot your data before trusting a line. The method assumes a roughly straight relationship, a similar spread of points along the line, and no extreme outliers. If the cloud of points curves or fans out, a straight line will mislead — consider a transformation or a non-linear model instead.
Linear regression calculator: summary
This linear regression calculator gives the line of best fit and its quality in one click. Pair it with the standard deviation calculator and keep learning with machine learning for beginners.