Everything else on this site so far has been supervised learning — you had labels and the model learned to predict them. k-means clustering is unsupervised: there are no labels, and the algorithm’s job is to find structure that was already there.
What k-means clustering does
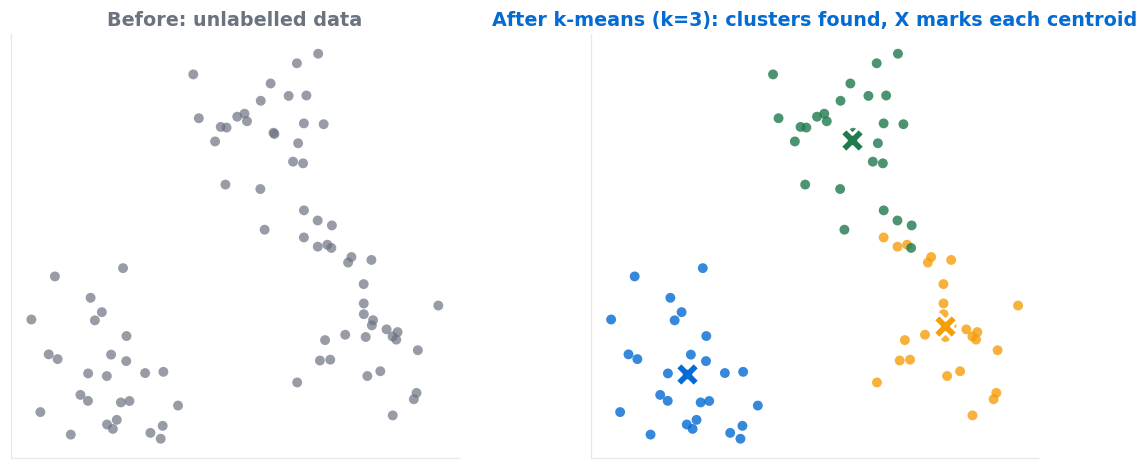
Typical uses: segmenting customers by behaviour, grouping documents by topic, compressing an image by reducing it to k colours, or simply exploring a dataset before you model it.
The algorithm, in four steps
Those centres are called centroids — the mean position of every point in a cluster. Step 3 is where the name comes from.
🧪 Worked example: one iteration by hand
Start: centroids randomly placed at 2 and 9.
Assign: 1, 2, 3 are nearer to 2 → cluster A. 10, 11, 12 are nearer to 9 → cluster B.
Move: centroid A becomes mean(1,2,3) = 2.0. Centroid B becomes mean(10,11,12) = 11.0.
Repeat: assignments do not change. Nothing moves. Converged in one iteration, with clusters {1,2,3} and {10,11,12}.
Under the hood, k-means minimises the total squared distance from each point to its centroid — a quantity called inertia. Every iteration is guaranteed to reduce it, which is why the algorithm always converges.
Choosing k with the elbow method
k-means clustering cannot tell you how many clusters exist. Ask for 5 and it will confidently return 5, even if the data has 2.
The standard approach is to run it for a range of k values, plot the inertia against k, and look for the bend. Inertia always falls as k rises — at k = n every point is its own cluster and inertia is zero — so you are not looking for the minimum. You are looking for the point where adding another cluster stops buying much.
⚠️ The elbow is often not obvious
Four things that will surprise you
| Behaviour | Why it happens | What to do |
|---|---|---|
| Different results each run | Starting centroids are random | Use k-means++ initialisation and multiple restarts (both are scikit-learn defaults) |
| Only finds round clusters | It assigns by straight-line distance | For elongated or nested shapes use DBSCAN instead |
| Outliers drag centroids | Centroids are means, and means are not robust | Remove outliers first, or use k-medoids |
| Nonsense on unscaled data | Distance-based, like k-nearest neighbours | Always scale features first |
k-means clustering vs k-nearest neighbours
The names are confusingly similar and the two are unrelated.
🔑 Key Takeaways
- k-means clustering finds groups in unlabelled data by alternating assign and move steps.
- You must choose k — use the elbow method, silhouette score, or domain knowledge.
- Results vary between runs because initialisation is random; k-means++ reduces this.
- It only finds roughly spherical clusters and is sensitive to outliers.
- Scale your features first, and do not confuse it with k-nearest neighbours.
Further reading
scikit-learn’s clustering guide compares k-means against DBSCAN and the other methods on awkwardly shaped data, and its silhouette analysis example shows how to choose k when the elbow is unclear.
Where to go next
- Cross-validation — the next post in this sequence
- Supervised vs unsupervised learning — where clustering fits
- PCA with NumPy — the other main unsupervised technique
- Start Here — the full learning path