Outliers matter more than beginners expect, because several common algorithms square their errors. One extreme value can visibly tilt a regression line or drag a cluster centroid away from where it belongs.
Finding outliers
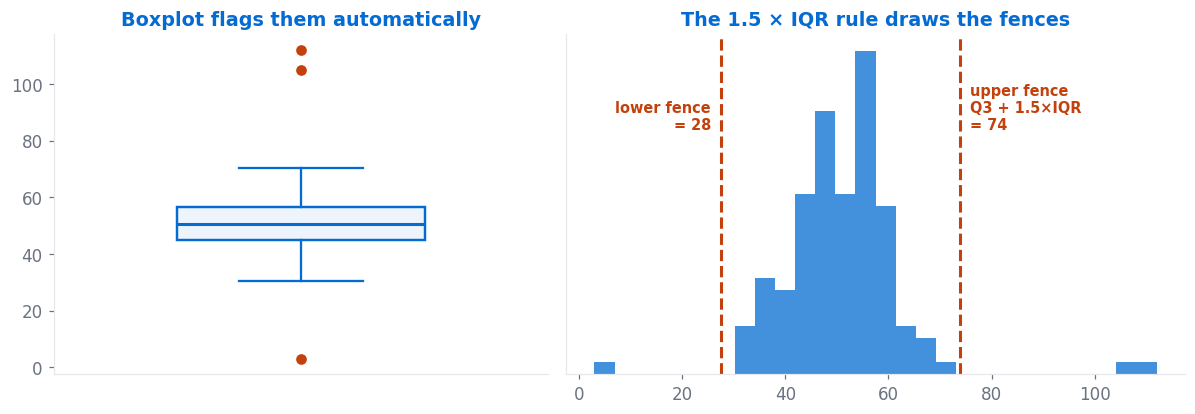
The 1.5 × IQR rule. Take the first and third quartiles, and the interquartile range between them. Anything beyond Q1 − 1.5 × IQR or Q3 + 1.5 × IQR is flagged.
$$\text{fences} = Q_1 – 1.5 \times IQR \quad\text{and}\quad Q_3 + 1.5 \times IQR$$
Z-scores. Flag anything more than about 3 standard deviations from the mean. Reasonable for roughly bell-shaped data, unreliable for skewed data, and vulnerable to the masking problem below.
Isolation Forest. A model-based approach for finding rows that are unusual across several columns at once. A 25-year-old is normal; a £2M income is unusual but possible; a 25-year-old with a £2M income and no employment history is the combination worth flagging. Single-column methods miss that entirely.
🧪 Masking: when outliers hide each other
By z-score: those two errors drag the mean to 148.9 and inflate the standard deviation to 296.6. The largest z-score in the whole column is 2.53. Nothing exceeds 3, so the z-score method flags nothing — the outliers have stretched the very yardstick you were measuring them with.
By IQR: the quartiles sit at 26.2 and 31.8, giving fences of roughly 18 and 40. Both typos land far outside. Both flagged.
One caveat worth knowing: if outliers make up a large share of your column — say 2 bad values among 5 good ones — even the quartiles get dragged and both methods fail. No rule survives a column that is a quarter garbage; at that point, fix the data source.
Deciding what to do
Detection is mechanical. The decision is not — and it depends entirely on why the value is extreme.
| Cause | Example | What to do |
|---|---|---|
| Data entry error | Age of 850 | Fix it, or treat as missing |
| Unit mix-up | Height in cm among metres | Convert it |
| Different population | A commercial unit in residential data | Remove — it does not belong in this question |
| Genuine extreme | A real £8M house | Keep it. It is real data. |
| The thing you are predicting | Fraud, equipment failure | Never remove. These are your positive class. |
⚠️ Do not delete outliers by reflex
Removing rows also shrinks your dataset and can bias it, since outliers are rarely spread evenly across groups.
Alternatives to deleting
Winsorising caps values at a percentile rather than removing rows — anything above the 99th percentile becomes the 99th percentile value. You keep the row and the fact that it was high, without the extreme magnitude.
Log transformation compresses a long right tail. Incomes of £20k, £40k and £2M become 4.3, 4.6 and 6.3 in log space — still ordered, no longer dominating. This often works better than any outlier removal for skewed money and count data.
Use a robust model. Tree-based models barely notice outliers, because a split only cares which side of a threshold a value falls on, not how far past it. Swapping MSE for Huber loss achieves something similar for regression.
Use robust scaling. If you are keeping outliers, scale with the median and IQR rather than the mean and standard deviation — see feature scaling.
🔑 Key Takeaways
- Prefer the 1.5 × IQR rule to z-scores — outliers cannot distort quartiles.
- Detection is mechanical; the decision depends on why the value is extreme.
- Never remove outliers when they are the thing you are trying to predict.
- Winsorising and log transforms keep the row while taming the magnitude.
- Tree models and Huber loss are robust to outliers without any preprocessing.
Further reading
scikit-learn’s outlier detection guide covers Isolation Forest and Local Outlier Factor for the multivariate case, and Wikipedia on Winsorizing explains the capping approach in more detail.
Where to go next
- Feature engineering — the next post in this sequence
- Interquartile range — the statistic behind the fences
- Imbalanced datasets — when the outliers are the point
- Start Here — the full learning path