A quick note on terminology, because the word is overloaded. This post is not about the b in wx + b, nor about statistical bias in the bias–variance tradeoff. It is about models that treat people unequally.
How one accuracy number hides bias in machine learning
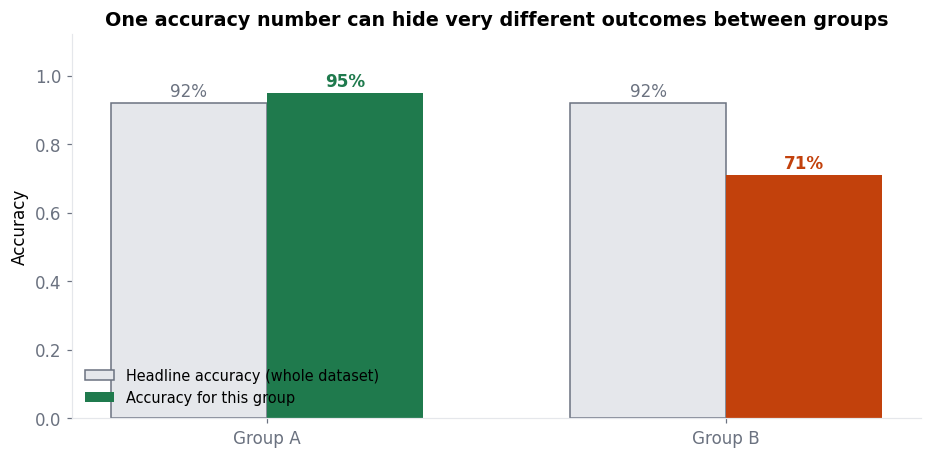
If Group A is 85% of your test set and Group B is 15%, a model scoring 95% and 71% respectively still reports 92% overall. The headline number is arithmetically correct and completely misleading. Nothing in a standard training run would flag it.
Where the bias comes from
Almost never from the algorithm. Gradient descent has no opinions. The problems enter through the data and the framing.
| Source | What happens | Example |
|---|---|---|
| Sampling bias | Some groups are under-represented in training data | A face dataset that is overwhelmingly one skin tone |
| Historical bias | The data faithfully records past unfairness | Hiring data from decades when few women were hired |
| Proxy variables | A permitted feature stands in for a forbidden one | Postcode encoding ethnicity almost perfectly |
| Label bias | The thing you measured is not the thing you meant | Using arrests as a stand-in for crime |
| Feedback loops | The model’s own outputs become tomorrow’s data | Policing where you patrolled yesterday, so you find more there |
⚠️ Deleting the sensitive column does not work
Worse, you have now made the bias harder to measure, because you no longer have the column you would need to check per-group performance. Keep the attribute for auditing; control separately whether the model may use it.
What “fair” actually means
Here is the uncomfortable part: fairness has several reasonable definitions, and they are mathematically incompatible. You cannot satisfy them all at once — you have to choose.
This is not a gap waiting to be closed by better mathematics; it is a proven impossibility. Which definition applies is a question about the specific decision being made, and it belongs to the people affected by it — not to the model.
A practical checklist
🧪 Five things to do on any model affecting people
- Ask who is in the data and who is missing before you train anything.
- Report metrics per group, not just overall. Accuracy, precision and recall for each.
- Check the error types separately. A false positive and a false negative rarely cost the same thing, and the balance often differs by group.
- Look for proxies. If a feature strongly predicts a protected attribute, using it may be equivalent to using that attribute.
- Monitor after deployment. Populations shift; a model fair at launch may not stay fair.
Step 2 costs about five lines of code and catches most real problems. It is the highest-value habit in this post.
Why this belongs in a beginner course
Because the decisions that create bias are made early — when the dataset is chosen, when the label is defined, when features are selected — and by then the harm is baked in. Waiting until a model is in production to think about it is waiting until it is expensive to fix.
It is also simply part of doing the work properly. A model that is 92% accurate overall and 71% accurate for a sixth of its users is not a good model. Measuring only the headline number means not knowing that.
🔑 Key Takeaways
- Bias in machine learning means measurably worse performance for some groups — and a single accuracy figure hides it.
- It comes from data, labels and framing far more often than from the algorithm.
- Removing the sensitive column does not remove the bias; it removes your ability to detect it.
- The main fairness definitions are mathematically incompatible — choosing between them is a human decision.
- Reporting metrics per group is cheap and catches most real problems.
Further reading
Google’s crash course section on fairness catalogues the common bias types with examples, and the Fairlearn library provides ready-made tools for measuring per-group metrics in Python.
Where to go next
- The confusion matrix — compute one per group, not one overall
- Precision and recall — the metrics that expose unequal error types
- Training data vs test data — where representation problems begin
- Start Here — the full learning path