Beginners tend to look for a better algorithm when results disappoint. Experienced practitioners look at the features first, because a model can only work with what it is given. Feature engineering is giving it more.
Why one derived feature can beat a better model
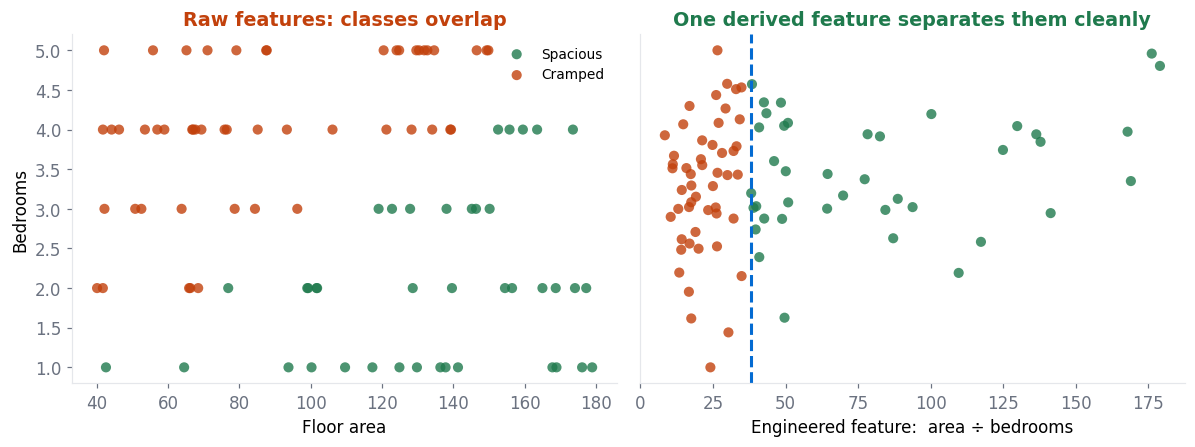
On the left, no straight line divides the two classes: large cramped houses and small spacious ones are mixed together. A linear model cannot do anything useful with those two columns.
Divide one by the other and the problem becomes trivial — a single threshold separates them. The information was always there; it just was not in a form the model could use.
The techniques worth knowing
Ratios and differences. The highest-value move, and the most overlooked. Price per square metre. Debt divided by income. Clicks divided by impressions. Days between signup and first purchase. Any time two columns are naturally compared, the comparison is usually more informative than either column alone.
Dates broken apart. A raw timestamp is nearly useless. Split it into day of week, month, hour, is-weekend, is-holiday, days-since-event. A model cannot see that Saturday behaves differently from Tuesday unless you tell it which day it is.
🧪 Cyclical features: the hour-23 problem
The fix is to map the cycle onto a circle using two columns:
hour_sin = sin(2π × hour / 24) and hour_cos = cos(2π × hour / 24)Now 23:00 and 00:00 sit next to each other, as they should. Any time a feature wraps around, it needs this treatment.
Binning. Turn a continuous column into bands — age into “under 25 / 25–40 / 40–65 / over 65”. Useful when the relationship is not smooth, and when you want interpretability. It does discard information, so test rather than assume.
Aggregations. Where you have repeated records per entity, summarise them: a customer’s average order value, their order count, days since last order. This is groupby work, and it is where most real predictive power lives in transactional data.
Log transforms. For anything with a long right tail — money, counts, populations — taking the log makes the distribution more symmetric and stops the largest values dominating.
Interactions. Multiply two features together when their combination matters more than either alone.
Domain knowledge is the real ingredient
The best features come from understanding the problem, not from applying transformations mechanically. Someone who knows property will tell you that price per square metre, distance to a station and school catchment matter — none of which you would invent by staring at column names.
Two ways feature engineering goes wrong
⚠️ Leakage and bloat
- Leakage — the serious one. A feature that would not exist at prediction time. Predicting whether a customer will churn, using “days since cancellation” — that column only has a value because they churned. Test accuracy looks superb; production accuracy is zero. Ask of every feature: would I actually know this at the moment I need the prediction?
- Too many features. Every extra column is another chance to find a coincidence, so overfitting gets easier. Add features with a hypothesis, and check whether each actually helps.
Checking whether a feature helped
Do not trust your intuition on this — measure it. Score the model with cross-validation before and after adding the feature. If the score does not improve meaningfully, drop it; a smaller feature set is easier to maintain and less prone to overfitting.
Tree models expose feature_importances_, which is a useful sanity check — though be aware it is biased toward high-cardinality columns. Permutation importance is more reliable: shuffle one column and see how much the score falls.
Does deep learning make this obsolete?
For images, audio and text, largely yes — neural networks learn their own representations, which is precisely why they took over those fields.
For ordinary table data, no. Gradient boosting on well-engineered features still wins most competitions and most real projects. If your data looks like a spreadsheet, feature engineering remains the highest-value thing you can spend an afternoon on.
🔑 Key Takeaways
- Feature engineering often beats a better algorithm on the same raw columns.
- Ratios and differences are the highest-value and most overlooked technique.
- Split dates apart, and encode cyclical features with sine and cosine.
- Leakage is the dangerous failure — ask whether you would know the value at prediction time.
- Measure every new feature with cross-validation rather than trusting intuition.
Further reading
scikit-learn’s preprocessing guide covers polynomial features, binning and spline transforms, and its permutation importance documentation shows the reliable way to check whether a feature earns its place.
Where to go next
- Hyperparameter tuning — the next post in this sequence
- Detecting and handling outliers — the previous step
- Overfitting and underfitting — what too many features causes
- Start Here — the full learning path