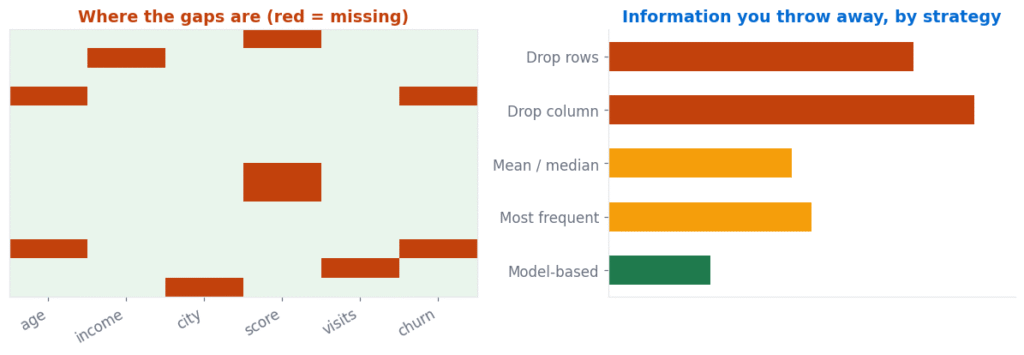
Handling Missing Data: 5 Proven Strategies That Work
Handling missing data properly: why the reason for the gap decides the fix, when imputing biases your model, and the leakage trap that inflates your scores.

Handling missing data properly: why the reason for the gap decides the fix, when imputing biases your model, and the leakage trap that inflates your scores.
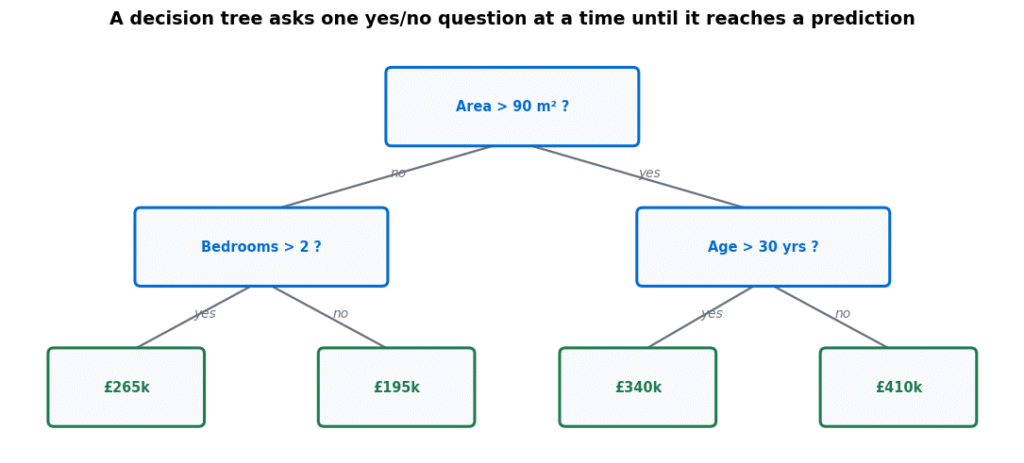
A decision tree splits data with yes/no questions chosen to maximise purity. Gini worked by hand, how to stop it overfitting, and why it needs no feature scaling.
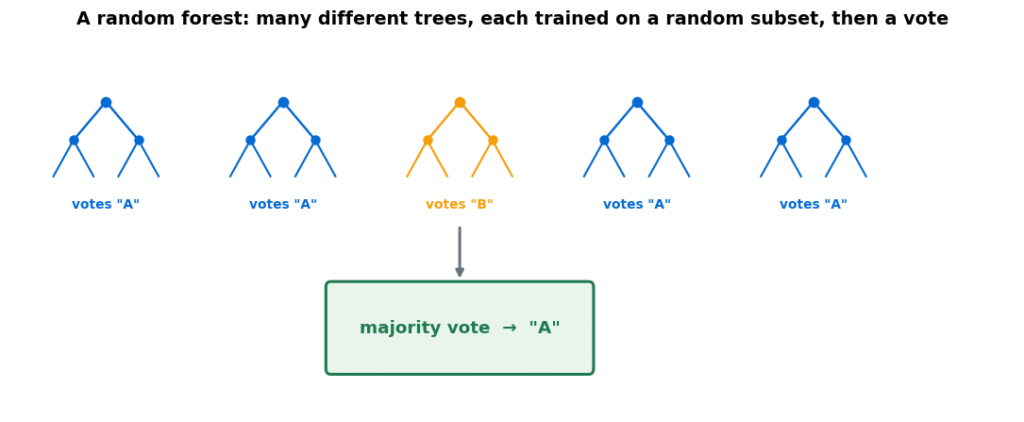
A random forest averages many diverse trees. Why random features matter more than random rows, free out-of-bag validation, and the one thing it cannot do.
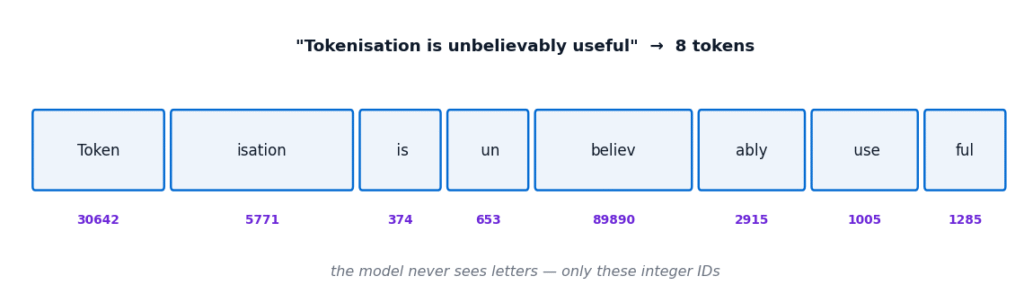
Tokenisation turns text into integer IDs. How Byte Pair Encoding builds the vocabulary, and why it explains miscounted letters, language costs and token billing.
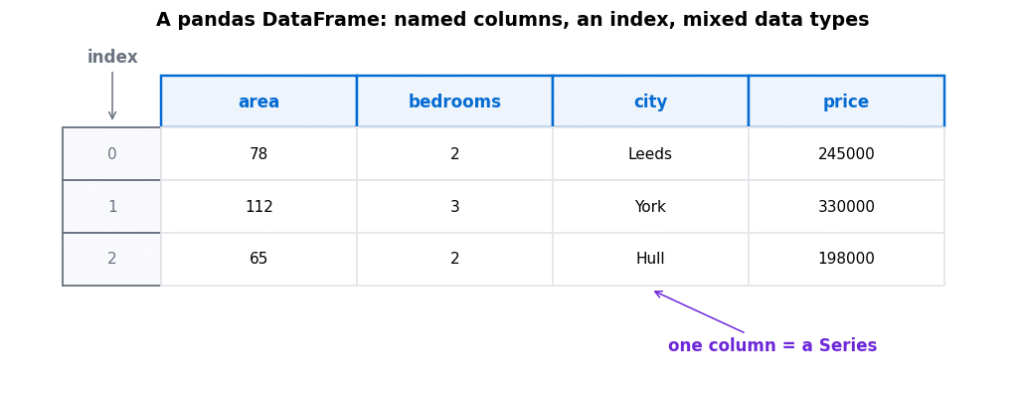
pandas basics for beginners: DataFrames and Series, loc versus iloc, groupby, and the five commands worth running before you model anything.
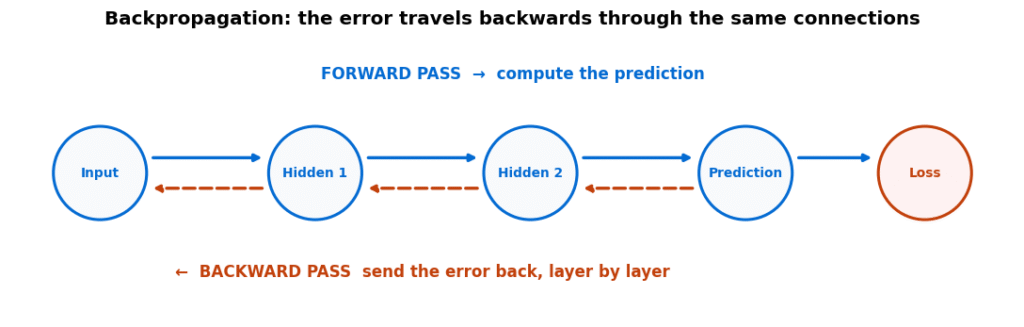
Backpropagation is the chain rule applied backwards. A complete worked example on one weight, why gradients vanish in deep networks, and what it is not.
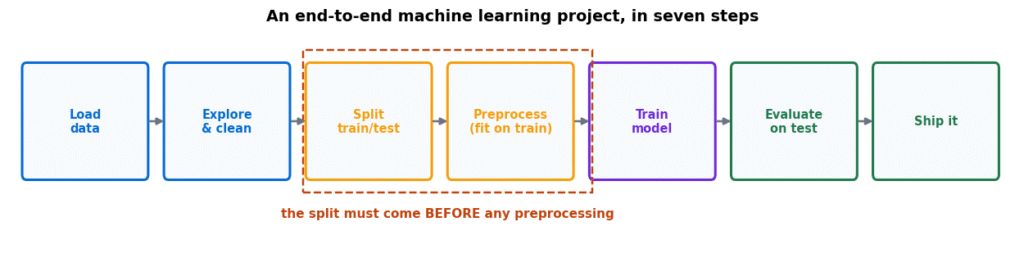
A complete machine learning project in order: load, explore, split, preprocess, train, evaluate, ship. Why the split comes first and where the time really goes.
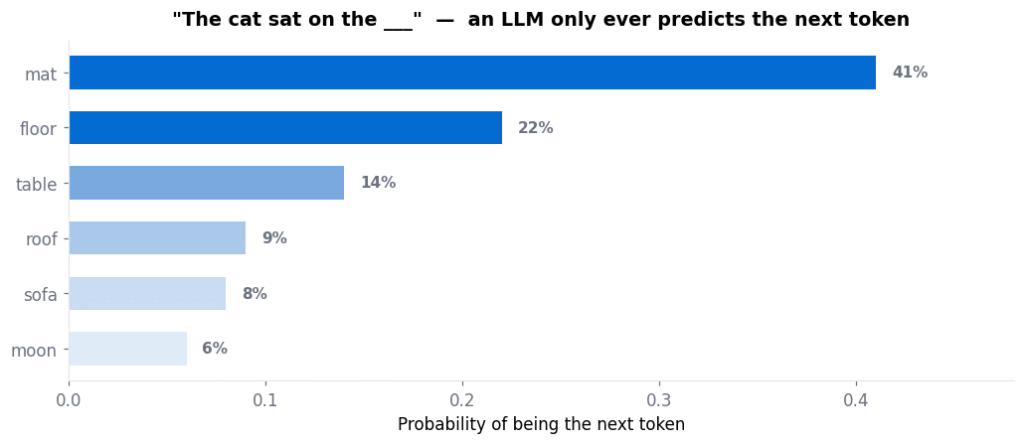
A large language model only predicts the next token. How pre-training works without labels, what temperature changes, and the five limits worth understanding.

NumPy for machine learning explained simply: array shapes, the broadcasting rule, the axis argument, and why vectorising beats looping every time.
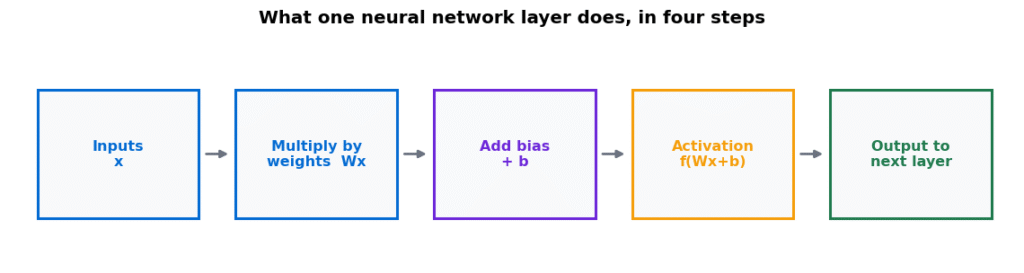
A neural network layer computes f(Wx + b). Every step worked through by hand with real numbers, plus the shape rule behind most NumPy and PyTorch errors.