Real datasets have holes. A sensor failed, a form field was optional, a record predates a column being added. Handling missing data badly will quietly distort every model you build on it, so it is worth doing deliberately rather than reaching for fillna(0).
First, find the gaps
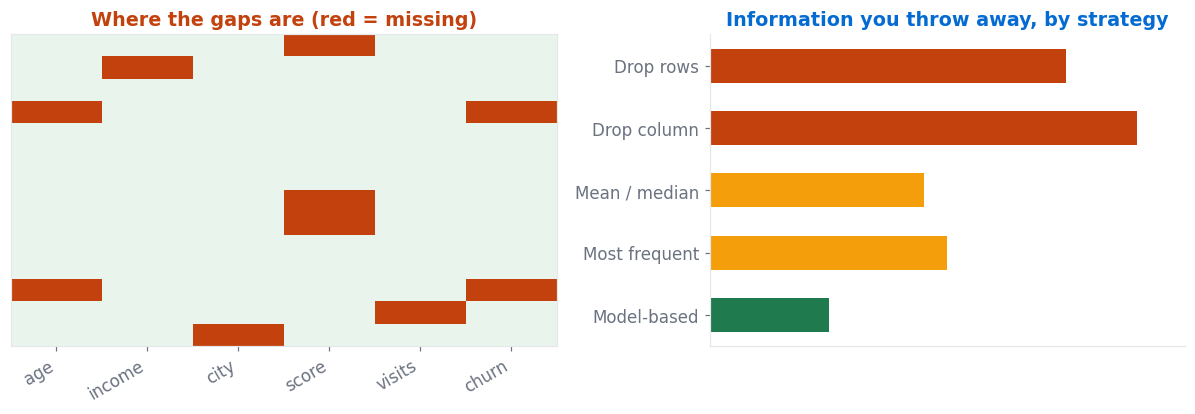
In pandas, df.isna().sum() counts gaps per column and df.isna().mean() gives the proportion. But the useful question is not how many — it is where. Are the gaps spread evenly, or concentrated in particular rows? Do two columns go missing together? Patterns like that are evidence about the cause.
Why the data is missing changes what you should do
| Type | Meaning | Example | Safe to impute? |
|---|---|---|---|
| MCAR | Completely at random | A sensor dropped readings at random times | Yes |
| MAR | Explained by other columns | Older respondents skipped the email field | Yes, using those columns |
| MNAR | The gap depends on the value itself | High earners declining to state income | No — imputing biases the result |
income_was_missing and let the model use it.The strategies, from crude to careful
Drop the rows. Fine if you are losing a small percentage and the gaps are random. Dangerous otherwise — dropping every row with any gap can silently remove a specific kind of person from your dataset.
Drop the column. Reasonable when a column is mostly empty — above roughly 60% missing there is usually little signal left. Check first that the column is not important; sometimes the best move is to collect it properly instead.
Fill with the mean or median. The common default. Use the median for anything skewed or with outliers — one billionaire in a salary column makes the mean a poor stand-in for everyone else. This keeps all your rows but shrinks the column’s variance, which makes the feature look more reliable than it is.
Fill with the most frequent value. The equivalent for categorical columns. Often better: fill with the literal string “Missing” and treat it as its own category, which preserves the information.
Model-based imputation. Predict the missing values from the other columns — k-nearest neighbours imputation uses similar rows; iterative imputation models each column in turn. More accurate, more compute, and easier to leak with if you are careless.
🧪 What mean imputation does to your data
You now have 20, 30, 35, 35, 40, 50. The mean is unchanged — but the spread has shrunk, because you added two values sitting exactly at the centre. Any correlation involving age is now weaker than it truly is.
This is not a reason to avoid mean imputation. It is a reason to know it happened, and to prefer adding a “was missing” flag so the model can tell real 35-year-olds from filled ones.
The mistake that inflates your scores
⚠️ Impute after splitting, never before
Correct order: split first, compute the fill value from the training set only, then apply that same value to both sets. In scikit-learn, put
SimpleImputer inside a Pipeline — that gets it right automatically, including inside cross-validation.This is the same rule as feature scaling, and for the same reason: anything that learns a value from the data must learn it from training data only.
A sensible default
- Count and visualise the gaps. Look for patterns.
- Ask whether missingness is meaningful. If it might be, add an indicator column.
- Drop columns above roughly 60% missing, unless you have a reason to keep them.
- Median for numeric columns, “Missing” as a category for text.
- Put it in a pipeline so it happens inside each fold.
- If the model matters, compare against KNN imputation to see whether the extra effort helps.
🔑 Key Takeaways
- Ask why data is missing before deciding how to fill it.
- If missingness carries meaning, add an indicator column rather than erasing it.
- Median beats mean for skewed columns; “Missing” as a category beats most-frequent for text.
- Imputation shrinks variance — the filled column looks more reliable than it is.
- Always fit the imputer on training data only, ideally inside a pipeline.
Further reading
scikit-learn’s imputation guide documents SimpleImputer, KNNImputer and IterativeImputer with the pipeline pattern, and Wikipedia on missing data covers the MCAR/MAR/MNAR distinction in more statistical depth.
Where to go next
- Encoding categorical variables — the next post in this sequence
- pandas basics — how to find the gaps in the first place
- Cross-validation — where imputation must live to stay honest
- Start Here — the full learning path