Normal Distribution Calculator Gaussian
Find probabilities and the density for a normal (Gaussian) distribution.
Show working (LaTeX)
This free normal distribution calculator finds probabilities and the density for any normal (Gaussian) distribution — P(X < x), P(X > x) and the area between two values.
How to use the normal distribution calculator
Enter a value x, the mean and the standard deviation, then press Calculate. The normal distribution calculator standardizes to a z-score and returns the left-tail, right-tail and between probabilities, plus the density. As a gaussian distribution calculator and normal probability calculator, it covers the everyday cases instantly.
What is the normal distribution?
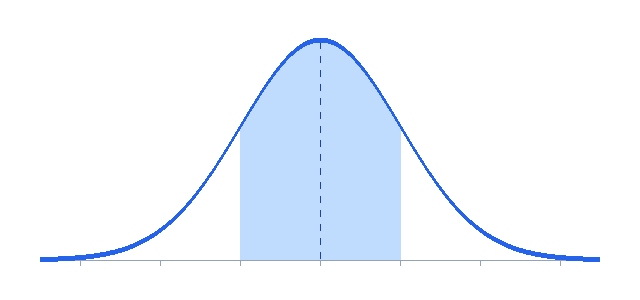
The normal, or Gaussian, distribution is the symmetric bell curve that describes much natural variation. See the normal distribution reference for the details.
Normal distribution formula
$$z=\frac{x-\mu}{\sigma},\qquad P(XHow to find a normal probability step by step
- Standardize: convert x to a z-score with the z-score formula.
- Look up the area to the left, $\Phi(z)$.
- Subtract or combine areas for right-tail and between probabilities.
Worked example
For a standard normal (mean 0, SD 1), $P(X<1.5)=\Phi(1.5)\approx 0.9332$, so about 93.3% of values fall below 1.5.
Why the normal distribution matters in machine learning
The normal distribution is everywhere in machine learning for beginners — from Gaussian Naive Bayes to weight initialization and the assumptions behind many tests. It is the basis of the z-score and the standard deviation.
🤖 ML insight
Neural network weights are often initialized from a normal distribution, and the central limit theorem is why averaged quantities tend to look Gaussian.
Frequently asked questions
What does this normal distribution calculator compute?
What is the standard normal distribution?
How do I find the area between two values?
What is the 68-95-99.7 rule?
Is the normal distribution calculator free?
Standard normal and the empirical rule
Any normal curve can be converted to the standard normal — mean 0, standard deviation 1 — by subtracting the mean and dividing by the standard deviation. That single transformation lets one table or one function answer every probability question.
The empirical rule is the quick mental version: roughly 68% of values fall within one standard deviation of the mean, 95% within two and 99.7% within three. It is why a value beyond three standard deviations is treated as a rare outlier, and why so much of statistics leans on the bell curve.
Normal distribution calculator: summary
This normal distribution calculator turns any value into a probability under the bell curve. Pair it with the z-score calculator and the standard deviation calculator.