Median Calculator middle value
Find the median (middle value) of any data set, plus quartiles and IQR.
Separate with commas, spaces or new lines. The calculator sorts them for you.
Show working
This free median calculator finds the middle value of any data set — sorting your numbers automatically — and also returns the quartiles and interquartile range.
How to use the median calculator
Enter your numbers into the median calculator above and press Calculate. It sorts the data, finds the median (the middle value), and shows Q1, Q3 and the IQR. As a middle value calculator and median finder, it handles both odd and even counts correctly.
What is the median?
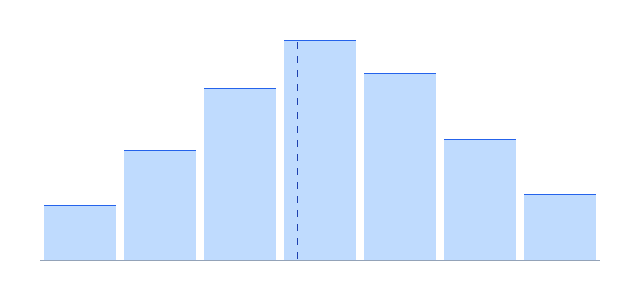
The median is the value in the middle of a sorted data set — half the numbers are below it and half above. See the median reference for more.
How to find the median step by step
- Sort the numbers from smallest to largest.
- If the count is odd, take the middle value.
- If the count is even, average the two middle values.
Worked example
For 8, 3, 9, 2, 7, 5, 10, sorted: 2, 3, 5, 7, 8, 9, 10. With 7 values the median is the 4th, so the median is 7.
Median vs mean
| Median | Mean | |
|---|---|---|
| Definition | Middle value | Average |
| Outliers | Resistant | Sensitive |
| Best for | Skewed data | Symmetric data |
Why the median matters in machine learning
In machine learning for beginners, the median is a robust way to fill missing values and to summarize skewed features without being thrown off by outliers.
🤖 ML insight
Median imputation — replacing missing values with the column median — is a common, outlier-resistant preprocessing trick.
Frequently asked questions
What does this median calculator return?
Do I need to sort my numbers first?
What if there is an even number of values?
How is the median different from the mean?
Is the median calculator free?
Quartiles, IQR and outliers
The median is the second quartile, Q2. The first quartile, Q1, is the median of the lower half and the third quartile, Q3, is the median of the upper half. The interquartile range, $\text{IQR}=Q_3-Q_1$, captures the spread of the middle 50% of the data and is the basis of the box plot.
A widely used rule flags any value below $Q_1-1.5\times\text{IQR}$ or above $Q_3+1.5\times\text{IQR}$ as an outlier. Because it depends on order rather than magnitude, the middle value resists those extremes far better than the average — which is why skewed figures such as income are usually reported this way.
Median calculator: summary
This median calculator finds the middle value and quartiles in one click. Compare it with the mean calculator and the standard deviation calculator.