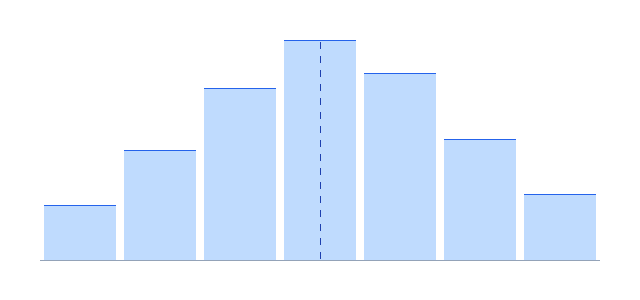
This free mean median mode calculator takes your list of numbers and instantly returns the mean, median and mode — plus the range, sum, count, minimum and maximum — with a dot plot showing where each measure falls.
How to use the mean median mode calculator
- Paste your numbers into the box (separated by commas, spaces or new lines).
- Press "Calculate."
- Read the three averages — and see them marked on the dot plot.
What are the mean, median and mode?
They are the three measures of central tendency — three answers to the question "what is a typical value?"
| Measure | What it is | How to find it |
|---|---|---|
| Mean | The average | Add all values, divide by how many there are |
| Median | The middle value | Sort the data; take the middle (or the average of the two middle values) |
| Mode | The most frequent value | Find the value that appears most often |
The formulas
The mean is the sum of the values divided by the count:
$$\bar{x} = \frac{1}{n}\sum_{i=1}^{n} x_i$$The median is the middle of the sorted data: with an odd count it is the single middle value; with an even count it is the average of the two middle values. The mode is simply the value (or values) that occur most frequently — a dataset can have one mode, several, or none.
Worked example
Take the numbers 4, 8, 15, 16, 16, 23, 42, 8, 16, 4 (the default above).
- Mean: the sum is 152 and there are 10 values, so \(\bar{x} = 152 / 10 = 15.2\).
- Median: sorted, the two middle values are 15 and 16, so the median is \((15+16)/2 = 15.5\).
- Mode: 16 appears three times — more than any other value — so the mode is 16.
Mean vs median: the outlier test
The mean and median agree when data is symmetric but split apart when it is skewed. One large outlier (like the 42 above) pulls the mean up while the median barely moves. That is why incomes and house prices are usually reported as medians — the median resists distortion from a few extreme values.
🤖 Why this matters in machine learning
Central tendency is the first thing you compute on any dataset. The mean is used to center features, the median fills missing values robustly, and both feed into the standard deviation. Go deeper with the standard deviation calculator, the variance calculator, or the interquartile range for spread.
Frequently asked questions
What is the mean median mode calculator?
How do you find the mean, median and mode?
Can a dataset have more than one mode?
What is the difference between mean and median?
When should I use the mode?
Common mistakes to avoid
- Forgetting to sort before finding the median. The median is the middle of the ordered data, not the middle of the list as typed.
- Confusing "no mode" with "mode = 0". If every value appears once, there is simply no mode — it is not zero.
- Using the mean on skewed data. A single outlier can make the mean misleading; report the median instead when the data has extreme values.
- Averaging the wrong two values for an even count. With an even number of data points, the median is the average of the two middle values, not just one of them.
The calculator handles all of these automatically — it sorts your data, detects one, several or no modes, and averages the two middle values when needed — so the mean, median and mode are always correct no matter how the numbers are entered.
Related tools
Keep exploring: Standard Deviation Calculator, Variance Calculator, Interquartile Range, or the formal reference on averages at Wikipedia.