Z-Score Calculator + PERCENTILE
Find the z-score, percentile and probability from a value & standard deviation — or straight from a data set.
Result
Show step-by-step working (with formula)
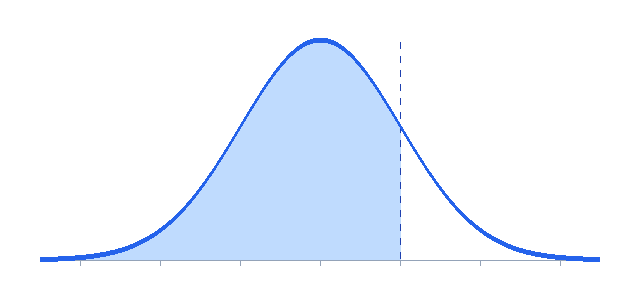
Probabilities use the standard normal distribution (Φ). A z-score tells you how many standard deviations a value is from the mean.
This free z score calculator finds the z-score of any value, then converts it to a percentile and probability using the normal distribution — either from a value, mean and standard deviation, or straight from your data set.
Key takeaways
- A z-score measures how many standard deviations a value is from the mean: $z=\dfrac{x-\mu}{\sigma}$.
- A positive z-score is above the mean; a negative one is below it; $z=0$ is exactly average.
- Convert a z-score to a percentile with the normal CDF, $\Phi(z)$.
- In ML, turning features into z-scores is called standardization.
How to use the z score calculator
The z score calculator at the top works two ways. If you already know the mean and standard deviation, type your value (x), the mean (μ) and the standard deviation (σ) and press Calculate. If you only have raw numbers, switch to the “I have a data set” tab, paste your values and the z score calculator computes the mean and standard deviation for you before scoring your value — and returns the percentile and probabilities too.
What is a z-score?
A z-score (also called a standard score) tells you how far a data point sits from the mean, measured in standard deviations. See the formal definition on the standard score reference and the NIST handbook.
“A z-score turns any value into a common, unit-free scale — so you can compare apples to oranges across different distributions.”
The z-score formula
For a population with mean $\mu$ and standard deviation $\sigma$:
$$z=\frac{x-\mu}{\sigma}$$When you’re working from a sample, use the sample mean $\bar{x}$ and sample standard deviation $s$:
$$z=\frac{x-\bar{x}}{s}$$How to calculate a z-score step by step
- Find the mean $\mu$ (or $\bar{x}$) of the distribution.
- Find the standard deviation $\sigma$ (or $s$). Need it? Use our standard deviation calculator.
- Subtract and divide: $z=\dfrac{x-\mu}{\sigma}$.
Worked example
A student scores 85 on a test where the mean is 70 and the standard deviation is 10:
A z-score of 1.5 means the score is 1.5 standard deviations above the mean — better than about 93.3% of students (the 93rd percentile).
Z-score to percentile table
| Z-score | Percentile (area to the left) | Meaning |
|---|---|---|
| −2.0 | 2.3% | Well below average |
| −1.0 | 15.9% | Below average |
| 0.0 | 50.0% | Exactly average |
| +1.0 | 84.1% | Above average |
| +1.5 | 93.3% | Top ~7% |
| +2.0 | 97.7% | Top ~2% |
| +3.0 | 99.9% | Extremely high |
Why z-scores matter in machine learning
If you’re into machine learning for beginners, you’ll meet z-scores as standardization — one of the most common preprocessing steps. The same idea connects to the covariance matrix and PCA.
🤖 ML insight
Standardizing a feature rescales it to mean 0 and standard deviation 1 using the z-score:
$$z=\frac{x-\mu}{\sigma}$$This keeps features on a comparable scale so gradient-based models (logistic regression, SVMs, neural networks) converge faster and no single large-valued feature dominates. Z-scores also flag outliers: values with $|z|>3$ are unusually far from the mean.
Frequently asked questions
What does a negative z-score mean?
How do I turn a z-score into a percentile?
What is a good z-score?
Do I use sample or population standard deviation?
Can the z score calculator work from raw data?
Z score calculator: summary
Whether you’re standardizing a test score or preprocessing features for a model, this z score calculator gives you the z-score, percentile and probabilities with the working shown. Pair it with the standard deviation calculator and keep learning with machine learning for beginners.