Standard Deviation Calculator SAMPLE + POPULATION
Enter any list of numbers to get the standard deviation, variance, mean, median, mode and range — with step-by-step LaTeX working.
Separate with commas, spaces, tabs or new lines. Decimals & negatives allowed — paste straight from Excel or Sheets.
Standard deviation & variance
Summary statistics
Show step-by-step working (with formulas)
Rounded to 4 d.p. Use sample (s) when your data is a sample of a bigger group; use population (σ) when it is the entire group.
This free standard deviation calculator finds the sample (s) and population (σ) standard deviation, variance, mean, median, mode and range from any list of numbers — and shows every formula in clean LaTeX, step by step.
Key takeaways
- Standard deviation measures how spread out numbers are around the mean.
- Use sample SD $s$ (divide by $n-1$) for a sample; population SD $\sigma$ (divide by $N$) for the whole group.
- Variance is the square of the standard deviation: $\sigma^2$ and $s^2$.
- In ML it powers z-score standardization: $z=\dfrac{x-\mu}{\sigma}$.
How to use the standard deviation calculator
Using the standard deviation calculator at the top of this page takes seconds: paste or type your numbers, then press Calculate. The standard deviation calculator instantly returns the sample (s) and population (σ) standard deviation, plus the variance, mean, median, mode and range — and a full step-by-step breakdown so you can see exactly how each result was produced. It’s a free, browser-based tool, so there’s nothing to install.
What is standard deviation?
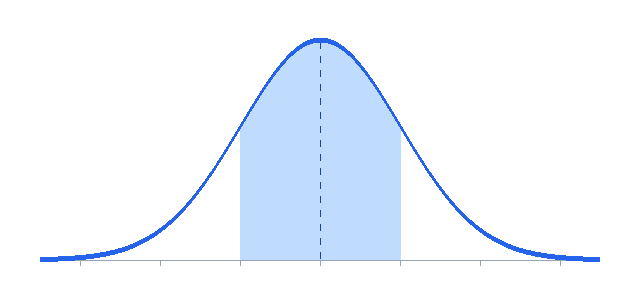
Standard deviation tells you how far, on average, the values in a data set sit from the mean. A small value means the numbers cluster tightly around the average; a large value means they’re widely scattered. For a formal definition, see the standard deviation entry on Wikipedia and the NIST/SEMATECH statistics handbook.
“The standard deviation is the most common way to quantify how much a set of values varies — the heartbeat of descriptive statistics.”
The standard deviation formula
Population standard deviation (use when the data is the entire group):
$$\sigma=\sqrt{\frac{1}{N}\sum_{i=1}^{N}\left(x_i-\mu\right)^2}$$Sample standard deviation (use when the data is a sample — the most common case):
$$s=\sqrt{\frac{1}{n-1}\sum_{i=1}^{n}\left(x_i-\bar{x}\right)^2}$$How to calculate standard deviation step by step
- Find the mean $\bar{x}=\frac{1}{n}\sum x_i$.
- Subtract the mean from each value to get deviations $x_i-\bar{x}$.
- Square each deviation: $(x_i-\bar{x})^2$.
- Sum the squared deviations: $\sum(x_i-\bar{x})^2$.
- Divide by $N$ (population) or $n-1$ (sample) to get the variance.
- Square-root the variance to get the standard deviation.
Worked example
For the data set 12, 15, 9, 20, 14, 18, 11:
Sample vs population: which should I use?
| Sample (s) | Population (σ) | |
|---|---|---|
| Denominator | $n-1$ | $N$ |
| Symbol | $s$, $s^2$ | $\sigma$, $\sigma^2$ |
| When to use | Data is a subset of a bigger group | Data is the entire group |
| Example | 30 survey replies from 10,000 users | Test scores of one whole class |
| Most common? | Yes (default in research & ML) | Less common |
STDEV.S is the sample SD and STDEV.P is the population SD. Picking the wrong one is the #1 cause of mismatched answers.Why standard deviation matters in machine learning
If you’re learning machine learning for beginners, the standard deviation calculator isn’t just a stats helper — it underpins how data is prepared for models. The same idea drives the covariance matrix and feeds directly into PCA dimensionality reduction.
🤖 ML insight
Before training, features are often standardized to mean 0 and standard deviation 1 using the z-score:
$$z=\frac{x-\mu}{\sigma}$$This keeps gradient-based models (logistic regression, SVMs, neural networks) numerically stable and helps them converge faster. Standard deviation also defines the width of the Gaussian used in Naive Bayes, and flags outliers beyond 2–3σ.
Frequently asked questions
Is this a sample or population standard deviation calculator?
Can I paste numbers from Excel or Google Sheets?
What’s the difference between variance and standard deviation?
Why divide by n − 1 for a sample?
How many numbers can I enter?
Standard deviation calculator: summary
Whether you’re a student checking homework or a data scientist scaling features, this standard deviation calculator gives you trustworthy results with the working shown. Bookmark it, paste your numbers, and you’ll have the sample and population standard deviation in one click. When you’re ready for the next step, try the related correlation matrix calculator or continue with machine learning for beginners.